|
|
Information box |
The main purpose of this site is to extend the
intraoperative monitoring to include the neurophysiologic
parameters with intraoperative navigation guided with Skyra 3
tesla MRI and other radiologic facilities to merge the
morphologic and histochemical data in concordance with the
functional data.
 CNS Clinic
Located in Jordan Amman near Al-Shmaisani hospital, where all
ambulatory activity is going on.
Contact: Tel: +96265677695, +96265677694.
Skyra running
A magnetom Skyra 3 tesla MRI with all clinical applications
started to run in our hospital in 28-October-2013.
Shmaisani hospital
The hospital where the project is located and running diagnostic
and surgical activity. |
|
 |
|
|
 |
Introduction |
 |
Interpretation of spectra from patients with
neuropathology requires a knowledge of the normal regional and
age-related spectral variations seen in the healthy brain. This
is a difficult issue, since spectra are quite dependent on the
technique used to record them (particularly choice of echo time,
and field strength), and also show quite large regional and
age-related (at least in young children) dependencies. However,
while there still remain some gaps in the literature (e.g.
detailed, regional studies in very young children),
for the most part regional and age-related changes in brain
spectra are now well-characterized. Here a review of what is
known about regional metabolite variations, as well as metabolic
changes associated with brain development, and aging.
|
|
Anatomical
variations in adult brain |
|
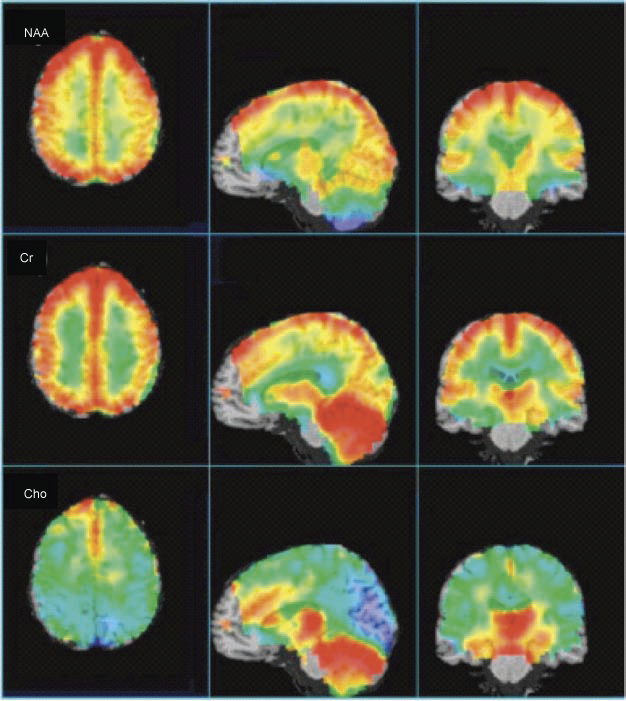
Figure-1 shows the average results from a 1.5 T whole brain EPSI
study (14 subjects, age range 27–48 (average 36)), recorded at
TE 70 msec. At the level of the lateral ventricles and above,
brain spectra show fairly characteristic patterns for gray and
white matter, although there are some anterior–posterior
differences, in particular with higher Cho in frontal brain
regions. Depending on the quantification technique used (and if
partial volume correction for CSF is applied or not), most
studies have found that the Cho is higher in white matter than
cortical gray matter, while Cr levels are lower in white matter
than gray matter. NAA levels (if measured without CSF
correction) are typically quite similar between gray and white
matter, but since cortical gray matter voxels typically have
more CSF contamination than white matter voxels, after CSF
correction, gray matter NAA concentrations are usually higher
than white matter. At the level of the third ventricle and
below, significant anatomical variations exist in brain spectra.
High levels of Cho are found in the insular cortex, thalamus,
and hypothalamus. Occipital Cho in the region of the visual
cortex is generally low. The pons has high levels of NAA and
Cho, and low levels of Cr, perhaps due to its high density of
fiber bundles. Cerebellar levels of Cr and Cho are significantly
higher than supratentorial values, and temporal lobe has been
reported to have lower NAA values. Significant
anterior–posterior differences have also been reported in normal
hippocampal metabolite concentrations, with lower NAA and higher
Cho in the anterior regions of the hippocampus. It appears that
metabolites are highly symmetric between the left and right
hemispheres in normal subjects, and that there are either no (or
minimal) gender differences.
| |
 |
|
| |
Figure-1: Average, CSF-corrected
metabolic images of Cho, Cr, and NAA presented in axial,
sagittal, and coronal views from a 1.5 T whole-brain
EPSI study (14 subjects, age range 27–48 years (average
36)), recorded at TE 70 msec. Highest NAA levels are
found in cortical gray matter (after CSF correction),
with lower levels in white matter, and anterior temporal
lobe, and cerebellum. Cr is highest in gray matter,
cerebellum, and basal ganglia. Cho shows high levels in
anterior mesial gray matter, basal ganglia, and
cerebellum. Some brain regions (brain stem, anterior
frontal lobe) are not included since spectra did not
meet minimal acceptable quality in these regions. |
|
The metabolic changes described above (for
Cho, Cr and NAA) are beautifully depicted in the representation
of whole-brain EPSI data from 14 subjects in Figure -1. The
axial view clearly shows higher Cr and NAA (CSF corrected) in
cortical gray matter, while also apparent on the axial view is
the high Cho signal in the mesial frontal gray matter. The
sagittal and coronal views show the high levels of Cr and Cho in
the cerebellum, as well as the thalamus, hypothalamus, and basal
ganglia.
The regional distribution of mI and Glx (only observable in
short TE spectra) has not received as much attention as Cho, Cr,
and NAA. One recent study was performed at 3 T using TE 35 msec
single voxel MRS found higher levels of Glx in gray matter than
white matter (as would be expected, since the major constituent
of Glx in normal brain is glutamate), and with the highest level
in the cerebellar vermis. Regional variations in mI were less
clear, although there were trends for mI to be higher in gray
matter than white matter, perhaps surprisingly since there have
been some studies suggesting that mI is found predominantly in
glial cells.
While brain metabolite concentrations will vary to some degree
on the quantitation method used to estimate them, Table-1 may be
of some value in determining the typical range of regional
metabolite concentrations found in normal, young adult brain. It
is cautioned that these values may vary somewhat from scanner to
scanner, so each user is encouraged to collect their own control
subjects using specific scanners and protocols for direct
comparison to values in patients.
| Location |
Field |
mI |
tCho |
tCr |
Glx |
tNAA |
| Frontal white matter |
3T |
3.74±
0.65 |
2.03±
0.39 |
7.21±
1.06 |
8.39±
2.02 |
11.28±
1.14 |
| Centrum semiovale |
3T |
2.89±
0.41 |
1.65±
0.25 |
6.69±
0.37 |
6.77±
1.90 |
12.13±
0.78 |
| Parieto-occipital white
matter |
3T |
3.3±
0.6 |
1.6
±0.24 |
6.14±
0.92 |
6.48±
1.58 |
10.97±
1.19 |
| Frontal gray matter |
3T |
4.4
±0.92 |
1.78±
0.59 |
8.35
±1.22 |
11.77
±1.92 |
11.8
±1.42 |
| Parietal gray matter |
3T |
4.3
±0.79 |
1.35±
0.16 |
8.95±
1.13 |
12.2±
2.66 |
11.86±
0.92 |
| Occipital gray matter |
3T |
4.77±
0.64 |
1.02
±0.09 |
9.31±
0.86 |
10.86±
1.81 |
13.23±
1.13 |
| Thalamus |
3T |
3.53±
0.52 |
1.89±
0.21 |
9.22±
1.15 |
10.33
±1.40 |
13.56
±0.71 |
| Pons |
3T |
4.8
±1.45 |
2.61±
0.44 |
6.72
±1.47 |
9.86±
3.52 |
12.91
±1.99 |
| Inferior vermis |
3T |
4.22
±0.91 |
2.1
±0.37 |
11.95±
1.15 |
12.89
±2.99 |
11.08
±1.02 |
|
Table-1. Regional metabolite concentrations (mM +
SD). |
|
|
Age-related
variations in child brain |
|
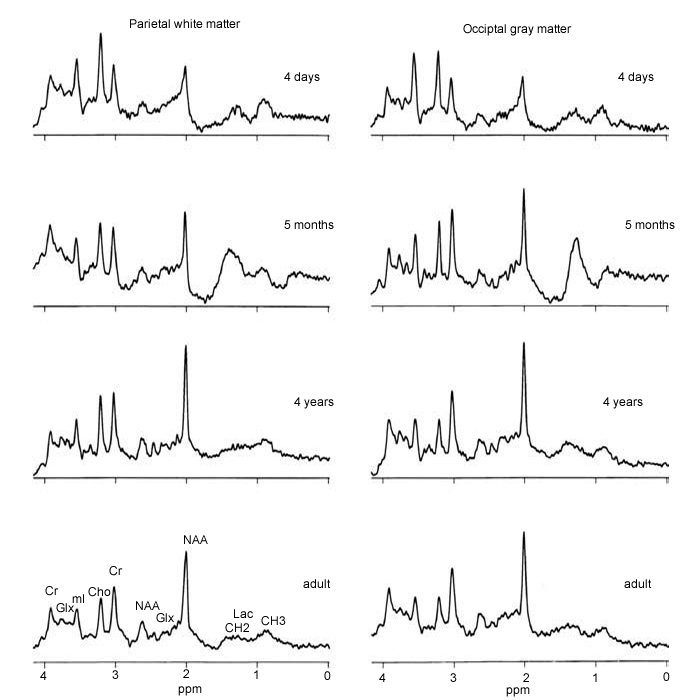
At birth, NAA is low, while Cho and mI are high, and over the
first few years of life there is a gradual normalization towards
adult values (Figure-2). Similar patterns are seen for both gray
and white matter, although regional developmental changes have
yet to be studied in detail. The major metabolic changes clearly
occur within the first year of life, with slower changes
occurring thereafter, with full adult values not being reached
until about 20 years of age.
| |
 |
|
| |
Figure-2: Age-related variations in
MRS – the normal developing brain. At birth, spectra of
both gray and white matter show low signals
from NAA and elevated levels of Cho and mI. As the brain
develops, NAA increases and Ch and mI decrease so that
by about 4 years of age
(in these locations) the spectra are essentially
indistinguishable from those in young adults. |
|
Some regions may also develop more slowly
than others, such as, for instance, frontal lobe white matter.
One study found a maximum NAA/Cho ratio in gray matter at about
10–12 years of age, after which it began decreasingly slowly.
This is interesting since this is also the age at which blood
flow and glucose supply to the brain is maximal, and may be
related to dendrite development (up to age 10–12) followed by
the onset of synaptic pruning thereafter.
|
|
Age-related
variations in elderly brain |
|
In contrast to studies of developing brain, studies of normal
aging by MRS are somewhat less concordant. Some groups find
lower NAA with increasing age, which may reflect neuronal loss,
while others find no change in NAA with age. In one study, NAA
was only reduced in subjects who also had cerebral atrophy as
identified by MRI.
Some groups have also found increased levels of Cr or Cho in
older subjects, perhaps reflecting increased glial cell density.
One of the earliest studies to report this finding was a
quantitative, multi-slice MRSI protocol which examined
correlations between metabolite concentrations and age (range
8–74 years).
Significant positive correlations were found between Cho
concentrations and age in both the genu of the corpus callosum
and the putamen (P < 0.02, Figure 4.9). Some regions showed
trends for decreasing NAA (for instance, posterior white
matter), but these did not reach statistical significance. The
discrepancies between different studies could be due to
technical factors in data collection and analysis, but probably
also reflect the wide physiological variations of normal human
aging, and hence depend on the study population. While more
studies are required to definitively establish the spectroscopic
characteristics of normal aging, it is apparent that the
metabolic changes associated with normal aging are much more
subtle than those associated with early brain development.
A recent meta-analysis of MRS studies of aging identified 18
studies (out of a total of 231 potentially relevant studies)
that quantified metabolite concentrations as a function of age.
These 18 studies included data from 703 healthy subjects, who
were split into younger (age range 4–56 years) and older groups
(68–89 years). Consistent with the above discussion, it was
found that between group differences were subtle, but indicated
increases in Cho and Cr in frontal regions with age, and
decreasing NAA only in the parietal region. The same study also
reported that Glx and mI have been less studied, and generally
report no change with aging.
|
|
Conclusions |
|
In summary, because of significant technique-, regional-, or
age-related changes, it is advisable that spectroscopy studies
for clinical or research purposes should always use age- and
anatomically matched spectra from control subjects for
comparison. These spectra should be recorded with identical
techniques and on the same scanner as those performed in
patients. In addition, spectroscopy scans of focal brain lesions
are often much easier to interpret if spectra from presumed
normal brain in the contralateral hemisphere are available for
comparison.
Finally, the interpretation of spectra from very young children
(term and preterm neonates, and children less than 1–2 years of
age) are particularly challenging because of the rapid changes
in brain metabolism that occur in these age ranges.
|
|
|